Area Between Curves
Video Transcript
| Video Frame | Narration |
|---|---|
|
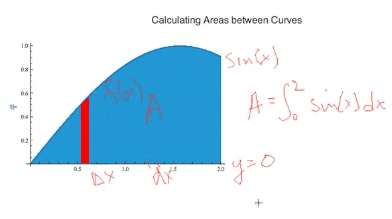
In this lesson, we want to talk a little bit about calculating areas between curves; but before we do that, let's review a little bit about calculating area using integration. |
|
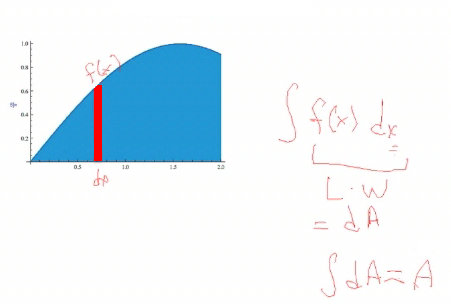
If you recall from Calculus I, if you want to calculate an area—this is a sine curve from 0 to 2—we know that this area is simply the integral from 0 to 2 of that function, sine of x, taken with respect to x. The dx's are along the x-axis. One thing you should have learned in Calculus I is that [these areas] are really the limit of taking rectangles, whose widths are delta x and whose heights are the function, and then putting an approximation bar across the area, adding them up, and taking the limit. If the limit exists, it is the definite integral, which gives you the area. Notice that this area is really between the function sin(x) and the other function y = 0. |
|
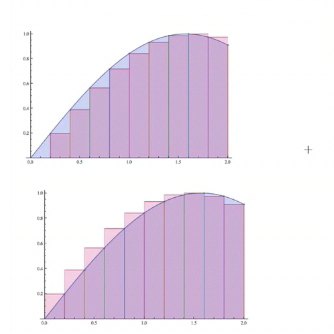
Here's our sine function divided up into rectangles. In these rectangles, the height is on the left-hand side of the rectangle. We can also take it so the values are on the right-hand side, but in the limit, it's been proven that all these approximations, if the limit exists, go to the same value, which is the definite integral, which is the area under the curve. |
|
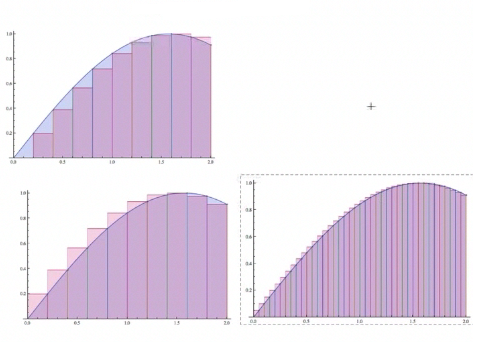
All we really did was keep that up, by taking the limit with finer and finer partitions—in other words, the size of delta x shrank while the number of rectangles increased. So you got more rectangles with smaller area; but in the limit, the large number of rectangles went to the limit of the area. |
|
So let's go back to our original graph of the sine. One thing that will help you in calculating the area—or any integral—is to figure out what small thing you are adding up. In this case for the area, it is rectangles. So we want to figure the width as dx, and the integration is going to be with respect to dx and the height is the function value. So the area is just the function, which is the length, times the width of the rectangle, which gives us a little increment of area. If we integrate that increment, we get the [total] area. |
|
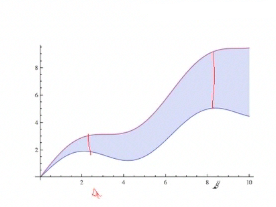
So in talking about the area between curves, it will usually be set up in two ways: either the area is trapped in some region … |
|
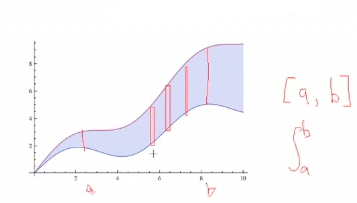
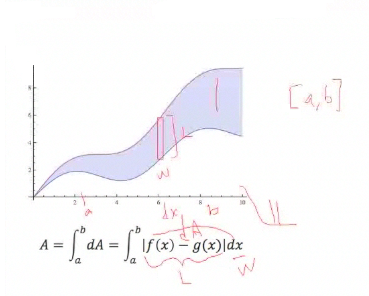
… or it is taking on some definite interval from a to b. So you'll have some interval defined—the starting point and ending point—and those will become the limits of integration. And then it helps you to take a rectangle, just draw it in—draw a couple of them in—to help you visualize what is going on with the curves. |
|
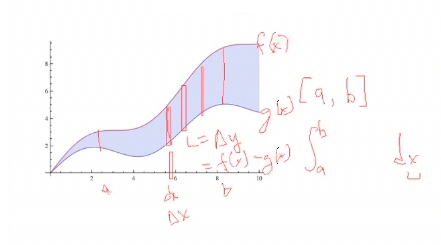
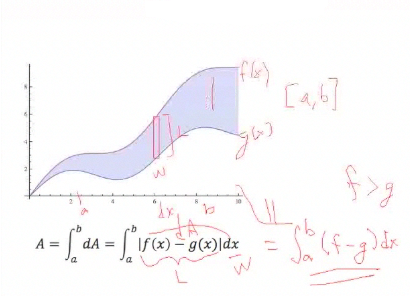
You can see that the width of these [rectangles] is actually delta x, so algebraically, it is going to go to the limit of integration of dx, so that tells you the variable you are integrating against. And the length is the top function f(x), and the lower function is g(x). The distance is just the difference in the y values, which is f(x) minus g(x). |
|
The way we write this mathematically, the area is the integral from a to b, if given a specific interval of integration, of the area increments, which you should determine as the length times the width of the rectangle. Its width is on the x-axis, so it is dx. The length is f(x) minus g(x). This gives a little increment dA, and we write it in terms of absolute value. That way it is always positive, so we are always adding up positive things. We have no problem if we go under the curve—we still get a positive area. |
|
This is a nice way to state it mathematically; but in reality, we have to figure out which function is the greater function and which function is below that, so that when we subtract we get a positive number and we can replace the absolute value with an actual algebraic expression. What we really want to end up with is the algebraic expression f minus g—whatever that comes out to be—since f is greater than g, that will always be positive, and the absolute value of a positive is just itself. That's our goal—to get rid of the absolute value. |
|
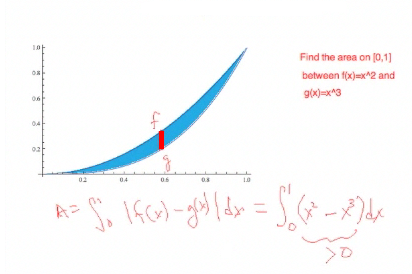
Let's look at a specific example. Here, we want to find the area on [0, 1] between the two functions f(x) = x2 and g(x) = x3. So we know the integral is going to be—I draw my little rectangles—the width is dx and the height is just the absolute value from 0 to 1 of f(x) − g(x). It's easy to write, but to solve this, we have to figure out which function is greater. We can either graph it out and check it, or we can just take a point [and substitute it into f(x) − g(x)]. If we take x = ½, then f(½) = ½2, which is ¼, and g(½) = ½3, which is ⅛. We see that ¼ is greater than ⅛, so the top curve is f(x) and the bottom curve is g(x). |
|
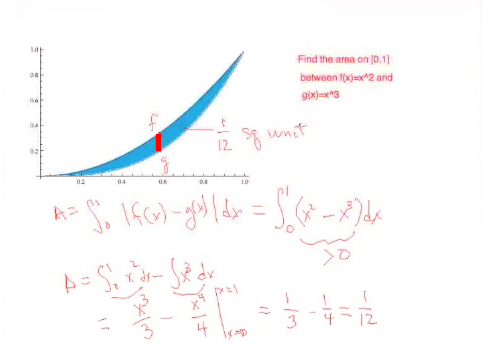
The area is given by the sum of all these little rectangles in the limit, and the rectangles are of length, f minus g. Since f minus g is positive, we can get rid of the absolute value sign in the expression—that's our goal, because we can't integrate an absolute value, we must integrate the actual algebraic statement. Because x2 minus x3 is positive, we can get rid of the absolute value signs, and the absolute value of a positive term is just that term. |
|
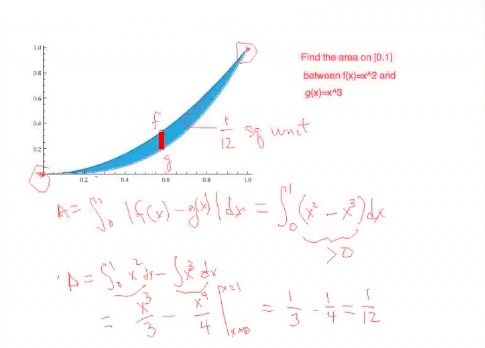
Now to do the integration. Because the sum of an integral is the integral of the sum, I can do each one separately. [I need to] find the antiderivative. By the fundamental theorem of calculus, I just evaluate over the endpoints and that gives me the definite integral. I just add one to the exponents and evaluate from x = 0 to x = 1, which gives me ⅟12. In other words, this blue area is just ⅟12 of a square unit, whatever our measurements are in. If our measurements are in feet, it is ⅟12 of a square foot; and if our measurements are in inches, it is ⅟12 of a square inch. |
|
Now also notice in this problem, we were given the endpoints x = 0 and x = 1. But in fact, the graphs cross at those points, so this area is trapped between those intersection points. A lot of times, when we are stating an area between the curves problem, you must figure out the a and b, the endpoints, yourself from the intersection points. In other words, what area gets trapped between some intersection points? So let's look at that. |
|
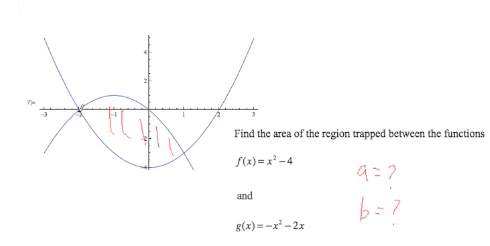
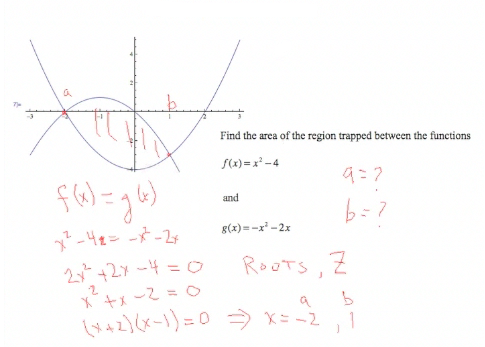
Suppose we are given the following problem: We want to find the area between the two curves x2 − 4 and −x2 − 2x. Notice that now, a and b are not given. We want the area that's trapped between the two curves, and a and b will be the points where the two curves intersect. |
|
To find a and b, we need to find where the y values are the same, so we need to find where f(x) = g(x). Set f(x) = g(x) and solve. Since it is a quadratic, we set it equal to zero. It's a good practice to set it equal to zero, because if you can't solve the equation, you can always solve it numerically by using a method like Newton's method or the quadratic formula that will find the zeros of the function. To solve the equation, we set it equal to zero, factor out a 2, factor x2 + x − 2 (and if you can't factor it, you can use the quadratic formula), and we get the results x = −2 and x = 1. So a = −2 and b = 1. |
|
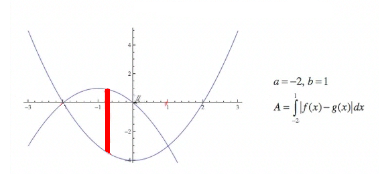
So the area will be the integral from −2 to 1 of the absolute value of the difference of the functions. Again, our goal is to figure out which function is on top and which is on the bottom so we can remove the absolute values. We found from our factorization that a = −2 and b = 1, so our integral for the area is going to be from −2 to 1 of the absolute value of the difference of the functions. So the question is, if we draw in the rectangles, which function is on top and which function is on the bottom? |
|
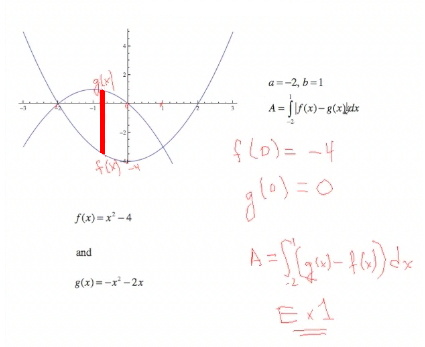
You can graph it, of course, but another way is to pick an intermediate point; and since the functions are continuous, once you get an intermediate point all the other points will be the same. We pick zero, and substitute it into f(x) and g(x) and find that f(0) = −4 and g(0) = 0. Zero is greater than negative 4, so our function on top is g(x) and our function on the bottom is f(x). Consequently, to get a positive value, we have to integrate from −2 to 1 of (g(x) − f(x))dx. This is exercise 1 in the exercises. See if you can complete this problem; but if not, the solution is provided there. |
|
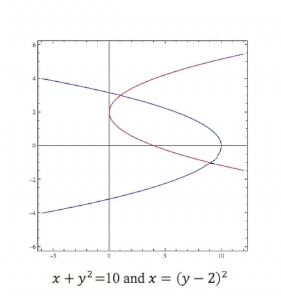
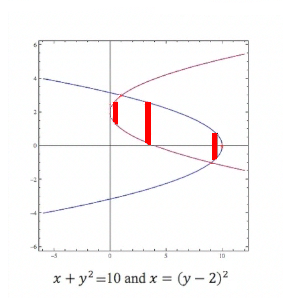
Here's another problem. We are going to find the area that's trapped between these two parabolas that are going sideways. Again, we would have to set these equal to each other and find our limits of integration. |
|
But notice that something funny is going on here: If we integrate over x [if we draw in the rectangles, sometimes they go from one parabola to the other and sometimes from one parabola to itself]. That means we have to break up the integral into three parts and we'll have to figure out each part; and we're going to have to figure out the intersections. |
|
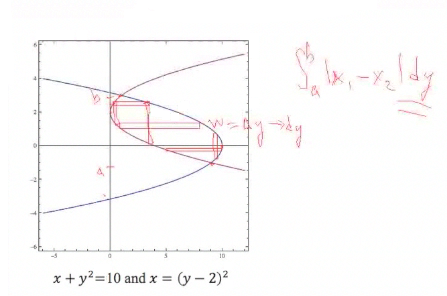
It turns out, we can look at this a different way. We can make the rectangles go from one parabola to the other, and we see in that case, the length is along the x-axis and the width is now along the y-axis, so the width is now delta y, which is going to go to dy, and the lengths are differences in x values. So I can actually set this integral up to be the integral from a to b, where a is on the y-axis and b is on the y-axis, and I want to integrate the absolute value in the difference of these lengths, which are now in terms of x, x1 − x2. These are functions of y, so I write dy because I am integrating with respect to y. This is a different way of looking at the problem, but it makes it a lot simpler. |
|
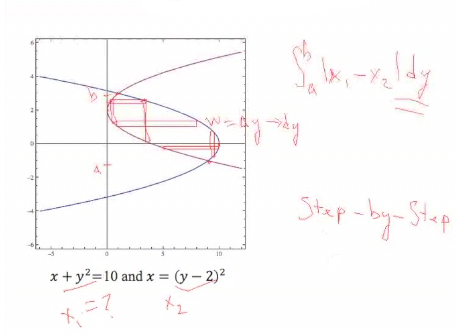
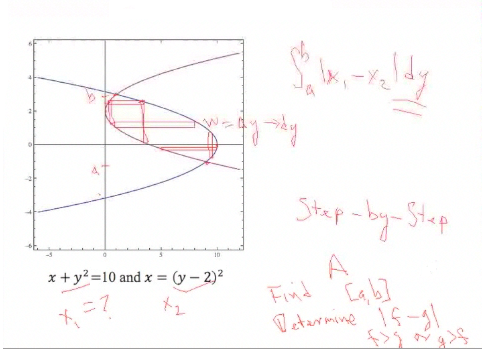
Now I need to solve these equations for x, put [the results] into the integral, [and] figure out which one is the top one all the time. [We can look at a graph], and checking a value will help, and integrate over y to get the area. This is worked out in the Step-by-Step examples, but try it yourself and if you can't work it out, you can see the solution there. |
|
We can see that area can be calculated a lot of different ways, but the main steps are:
|
![calculation to find the area between two curves on the interval [0,1]](images/vt2-11.png)