Population Growth
Video Transcript
| Video Frame | Narration |
|---|---|
|
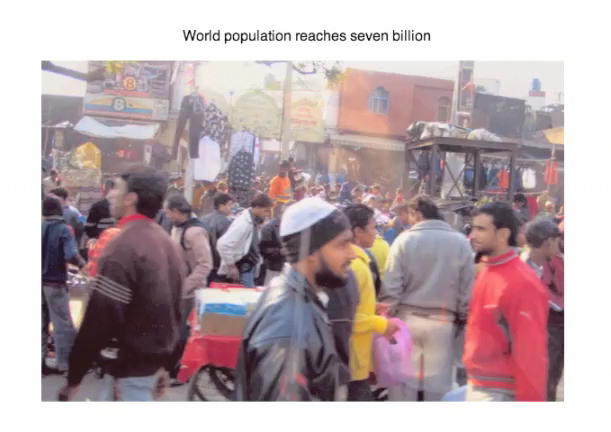
Depending on whose data estimates you use, sometime between Halloween of 2011 and April Fool's Day of 2012, the world population reached seven billion people. So in this lesson we want to investigate some of the different population models and see how they might apply to our world population and predictions of its future growth and size. |
|
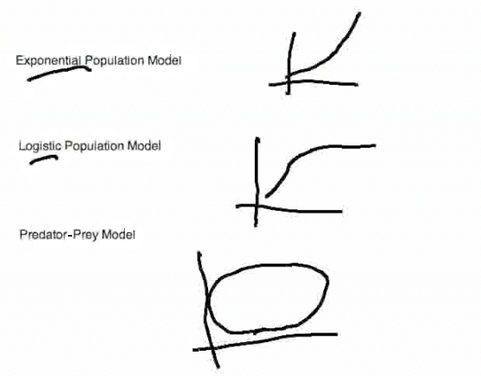
To investigate population models, we want to look at three basic models: Exponential population model, which is basically an uninhibited population growth [model]. In other words, the population starts at some level and seems to grow exponentially. Logistic population model, which is usually restricted by lack of food or lack of space. So the model seems to go up but then then levels off, so there is some asymptotic behavior. Predator-prey model, where there is an interspecies relationship. One species is preying on the other, keeping its population down. But when it eats up all its prey, its population will decrease. This usually has some cyclic behavior—its population will grow and then decrease. |
|
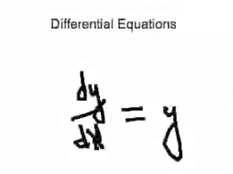
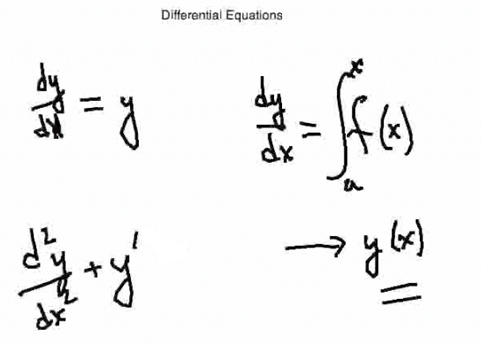
All these models result from the idea of differential equations, which I want to talk about first. A differential equation is basically an equation that contains a derivative, or a high-order derivative. So differential equations are equations that contain derivatives. Remember that derivatives can be written as dy/dx. So if we write this as an equation, dy/dx = y, that's a differential equation. |
|
You have already been solving differential equations in Calculus II in the sense that you have the derivative given as some function, and then, to define y, you integrate f(x) from a to x, or just find the antiderivative, basically. So you seek a solution that's just a function, y(x). A differential equation differs from an algebraic equation: In an algebraic equation, you just want to solve for a number or a set of numbers. In a differential equation, you want to solve for a function that solves that. There can be higher-order derivatives in the problem—one common differential equation is the second-order equation—and usually we write the derivatives in terms of prime notation, so we get differential equations of this look. |
|
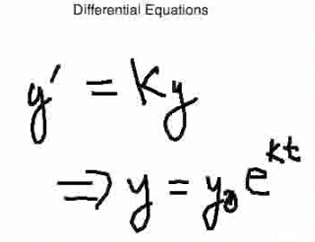
Another differential equation that you already solved (although the method of solving these equations is beyond the methods of this course—you have to take a course in differential equations itself [to learn how to solve such equations]) we did guess at the solution to this particular problem. We are saying that the rate of change is proportional to the size of the function. In other words, this is a common population model. It says that the rate of growth is proportional to, or equal to, some constant times the size of the population. So that resulted in the exponential model. |
|
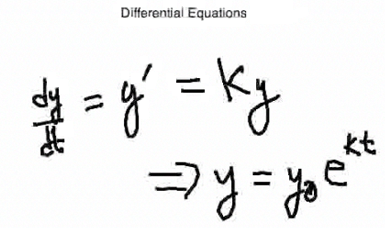
We have the initial population, so y0 here is the original population, and it grew exponentially as a function of time, t. |
|
So here the derivative is with respect to time. So it's really dy/dt. |
|
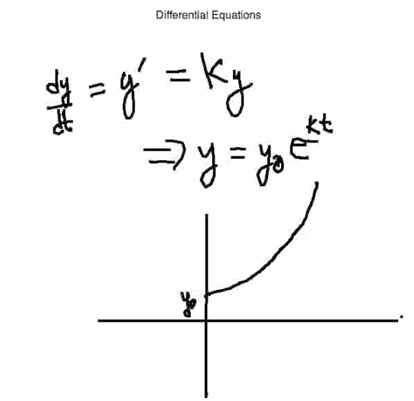
If you examine this type of population model graphically, it starts at some initial value—some starting population—and grows, depending on the time value k; and the bigger k is, the faster this will grow. So you can plug in some numbers and graph this in different ways. This is covered in more depth in the Step-by-Step [Explanation] solutions section of this topic. This is applicable to population models that don't really have any inhibitors like bacterial growth in the short run, and things like that. But the question is, does the world population—since man doesn't have any predators, and hopefully hasn't run out of food yet—do we have this kind of exponential growth? |
|
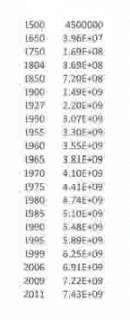
Here's a table of population values that I have taken from the Internet. Depending on the source—the Census Bureau or the World Population Bureau—numbers can differ because it is so hard to count people. |
|
This is the year and this is the population, and you can see that [the population] is going up. We can plot this and see what it looks like so we can see if we can fit some particular model to it. This data is given in the Step-by-Step Explanation section of this topic. |
|
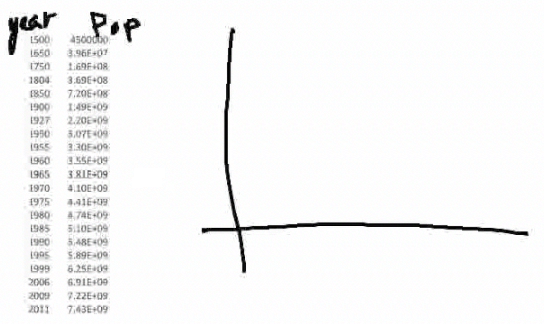
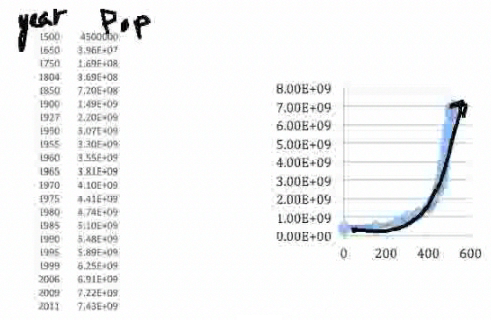
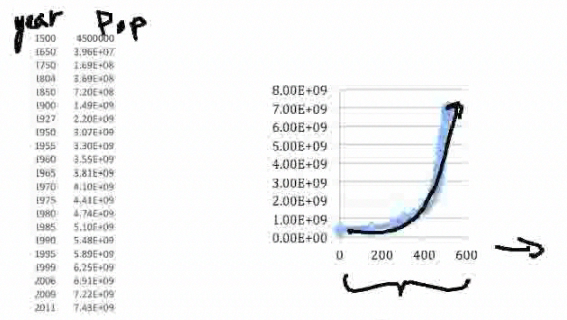
Here is a crude graph I did with Excel, and certainly the way it's going, it looks like it's a nice exponential model. It's going straight up like this, but again, it's hard to verify from a graph. We want to find some methodology to see mathematically how well we can fit this data—do we really have an exponential model or not?—and use that model to predict the future beyond these years. |
|
Now my x-axis is the difference in years from the beginning. So I took 1500 as year zero. (This is explained further in the Step-by-Step section of this topic.) |
|
One thing I want to mention—if you've had chemistry you may be aware of it—is the use of log paper when you want to determine if something is exponentially growing. It's a little hard to see here, but log paper is basically a log scale along the y-axis, and there is even spacing along the x-axis, so that is just a normal linear scale. (You can have log log paper, also.) What you want to do is graph your results on the log paper; and if the results lie in a straight line, then you have exponential growth. The numbers on the y-axis are not just 1, 2, 3, 4. They are 101, 102, 103, [and] 104, so 109 is really one billion and 1010 is ten billion. |
|
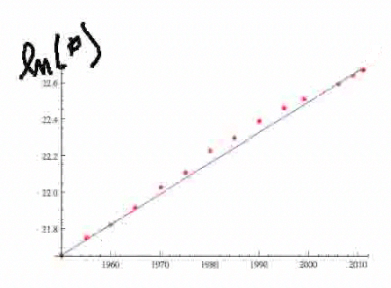
Let's graph our population table on graph paper and see what happens. Here's a graph I did with data from 1950 to 2011. (More graphs in the Step-by-Step [Explanation] examples.) If you look at the early years, it was growing somewhat exponentially, but not quite [exponentially]. But in the later years, it seems to be—now that we've taken care of some of the diseases and other things that inhibited the growth—it seems to be very linear in a log-log scale. [The y-axis] is actually the log of the population—the natural log—and you can see we get a fairly good fit. |
|
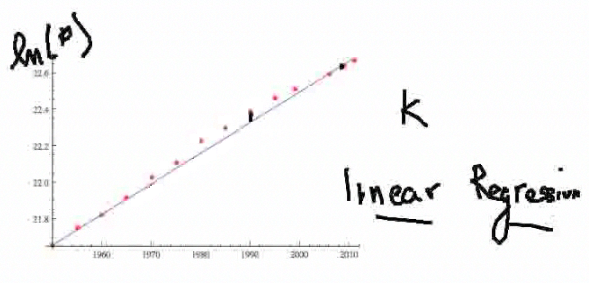
How do we get the best line to figure out what k is—the constant of growth? Again, we cover this in the Step-by-Step examples, but I want to mention here that now that we have the log on a linear scale, we can use linear regression. Linear regression is just a fancy term for what you learned in Calculus I in the sense of least squared fit. You are minimizing the square of the error between the data and the values on the line. In statistics, that is called linear regression. |
|
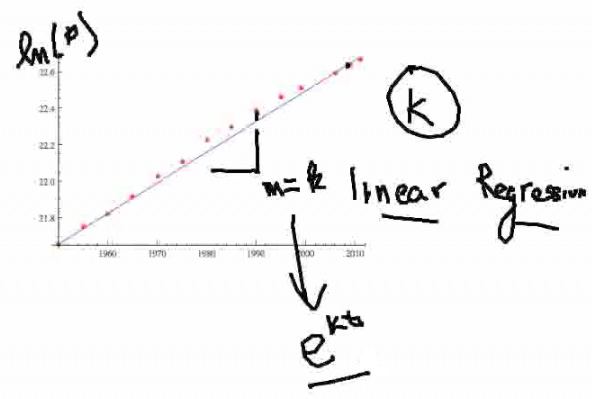
Linear regression techniques are programmed into a lot of software, including Excel, so you can find out what this k value is directly from the slope. k relates to the slope of this linear regression line. And that, in turn, relates to the k in the exponential model. |
|
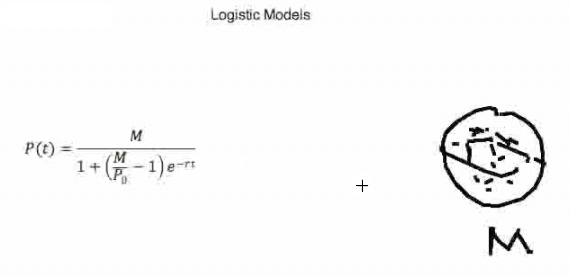
In logistic models, you assume that there is some maximum level that the environment can support, as far as the population goes. The fact that we live on a sphere with finite volume and surface area says that we will probably run out of places to put people. |
|
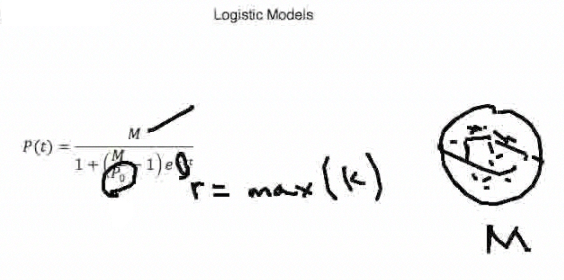
In the logistic model, the differential equations assume there is some maximum growth rate and growth constant, k, and there is a maximum level that this will all support, usually denoted by M. So we solve the related differential equations for the logistic model—which is beyond the level of this course—but we will assume this is the solution. |
|
We get something that looks like this:
|
|
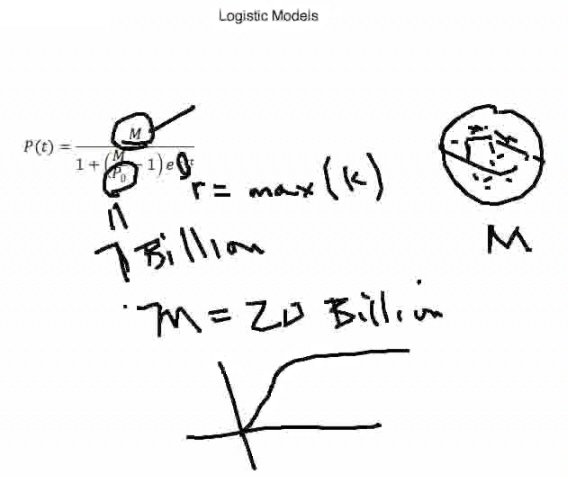
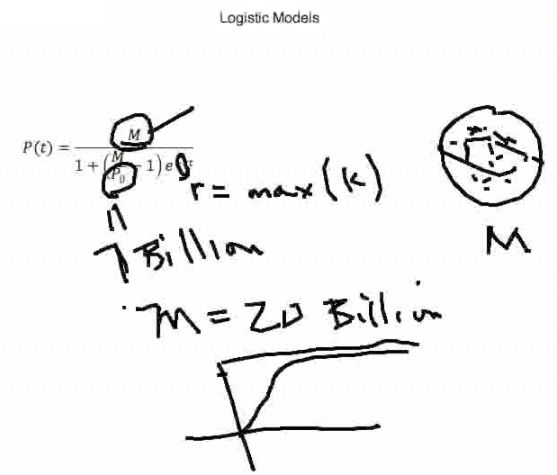
If we do some analysis, we can get a good guess on r (given in the Step-by-Step section of this topic), but we have to assume some maximum. So how many people do we expect the population of Earth to be, limited [only] by [availability of] resources? In the 1800s, someone tried to make this prediction and was way off, saying that the population would never get above 1 billion. I took an M value of 20 billion, which is somewhere in the literature. You can see in the Step-by-Step section that when we do this, things take off exponentially, but then they level off. |
|
So we can ask questions like, when will we reach 95 percent of that [20 billion]? [The graph] is asymptotic, so you never reach that value. We should determine what the asymptote is, but the model never reaches that. So we just ask questions like, when will we get to a level that will be 95 percent of that value? |